#
#
Drawdowns Against Safe Assets
We have already defined the drawdowns of a strategy against cash. It corresponds to the raw peak-to-trough losses of the asset against cash:
\text{Drawdown vs Safe} = 1- (\text{Porftolio Value} / \text{Peak Historical Value}).
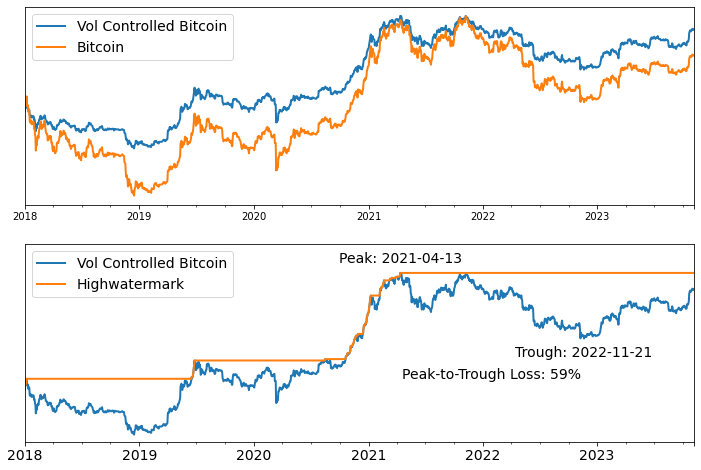
The figure below illustrates the performance and drawdown against the safe asset of a Volatility Controlled Bitcoin fund from 2018 to 2023. The strategy performs well: it generates an annual return of 27% (Sharpe .6) against a return of 17% for Bitcoin (Sharpe .27). However, it still exhibits a drawdown of 59% against the safe asset.

Everything else equal, investors dislike drawdowns against the safe asset. However, drawdowns against the safe asset provides a partial picture of what investors care about. Investors dislike losing money if markets tumble, but investors also dislike missing out on a growing market. A good risk-management strategy needs to balance these two objectives.
#
Drawdowns against Risky Assets
In published research (1, 2), our co-founder Sylvain Chassang, introduces a novel metric providing a more complete picture of investors' objectives: drawdowns against risky assets.
Specifically, the drawdown of a portfolio against a risky asset are the maximum foregone returns of the portfolio compared to the risky asset. It is formally defined as follows.
We first introduce a portfolio's relative value \text{Relative Value} compared to what the investor's wealth would have been if they had been fully invested in the risky asset (say Bitcoin).
\text{Relative Value} = \text{Current Portfolio Value} / \text{Value of the Risky Asset}.
The drawdown of a portfolio versus a risky asset corresponds to peak-to-trough losses in the relative value of the portfolio.
\text{Drawdown vs Risky} = 1- (\text{Current Relative Value} / \text{Peak Historical Relative Value}).
For instance imagine that an investor sell 1 Bitcoin, and invests it in some fund. After 1 year, the fund is worth 1.2 Bitcoins, but after 2 years, the fund is only worth .8 Bitcoins. At the end of year 2, the fund's drawdown with respect to Bitcoin is 1 - .8/1.2 = 33\%.
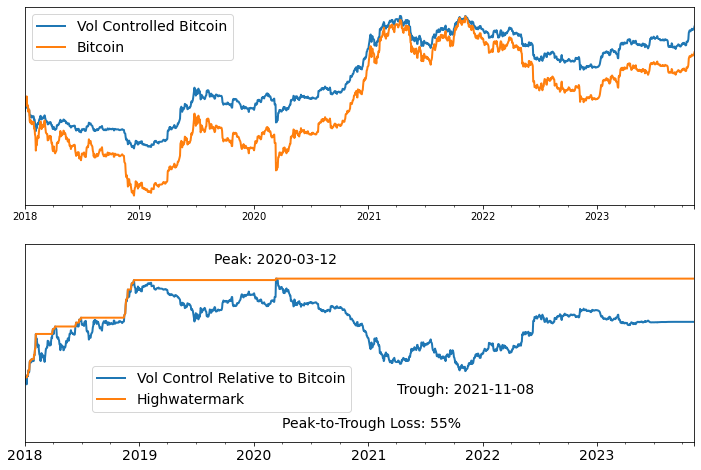
The figure below illustrates the performance of Vol Controlled Bitcoin's, and its drawdown relative to Bitcoin itself.

From peak-to-trough, Vol Controlled Bitcoin loses the advantage it had accumulated over Bitcoin: in relative terms, it underperforms Bitcoin during this period.
#
Balanced Drawdown Control
Good risk-management should limit both hard losses -- drawdowns against the safe asset -- and foregone returns -- drawdowns against the reference risky asset of interest.
Our research establishes 2 benchmark results:
- The optimal portfolio chosen by an investor that has correct anticipations about market risk will experience low drawdowns against both safe and risky assets with large probability.
- It is possible to construct Balanced Drawdown Control strategies that achieve low drawdowns with respect to both safe and risky assets for most market configurations provided instantaneous market moves do not become large.
Our preferred risk-management approach is based on Balanced Drawdown Control. Concretely, Balanced Drawdown Control strategies achieve low drawdowns by dynamically adjusting the portfolio's allocation weights between reference safe and risky assets.
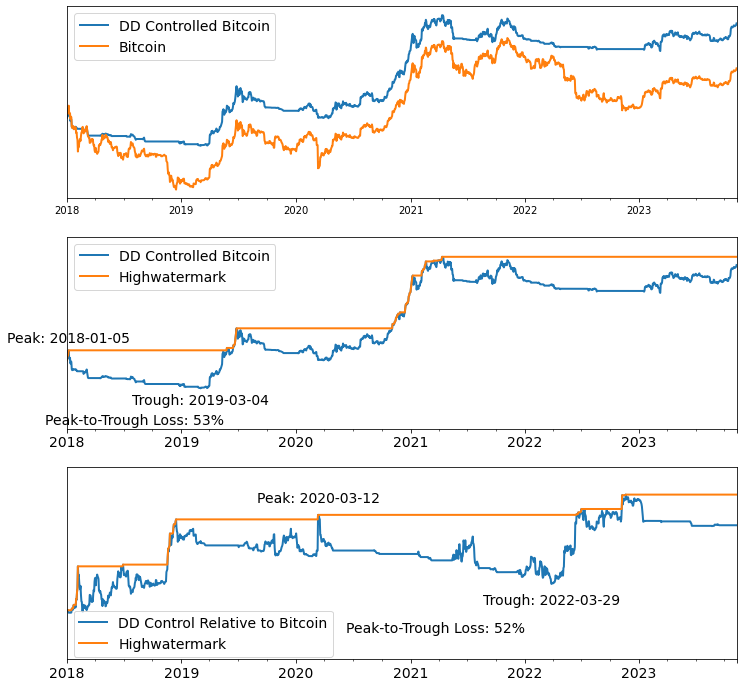
The figure below illustrates the performance and drawdowns of Balanced Drawdown Control applied to Bitcoin from 2018 to 2023. Balanced Drawdown Controlled reduces maximum drawdowns resulting in annual returns of 38% (Sharpe .8)

An important caveat noted above is that Drawdown Control cannot protect you against instantaneous adversarial market moves. If you are fully invested an asset, and public news makes the asset suddenly worthless, Drawdown Control cannot help you manage this catastrophic loss. Drawdown Control helps you deal with progressive changes in markets.
Metaphorically, Drawdown Control is like a car's ABS, but it's not like an airbag. It keeps you from sliding off the road, but can't help you if you hit a tree.
#
Balancing losses and foregone returns
The key parameter used to specify a balanced drawdown control strategy is the relative weights assigned to hard losses, and foregone gains. As investors, we feel that hard losses are a little worse than foregone gains, so we place a weight of 1.5 on hard losses, and a weight of 1 on foregone gains.
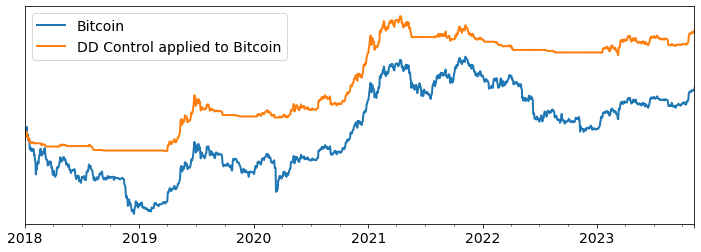
The figure below plots the impact of applying our preferred balanced drawdown controlled strategy to bitcoin from 2018 to 2023. Over this time period, the strategy generates an annual return of 43%, a Sharpe of 1.05, and experience a maximum drawdown against the safe asset equal to 53%.
