#
#
Other tools of the trade
Quantitative investors use a large number of risk-on risk-off strategies besides Regular Rebalancing (RR), Volatility Control (VC) and Drawdown Control (DDC). Some of them are explicitly about risk-management, and some of them are more about trend detection, but end up having risk-management applications.
Although we have our favorites, we think the majority of investors would benefit from using any of the strategies we list below. These are all healthy risk-management strategies that improve investors' experience, and we track all of them.
In fact, because investors need to stick to their risk-management plan we think it's important you choose a risk-management solution that you find persuasive. For this reason, if you have a strong opinion and would like us to include an index based on a risk-management strategy we don't offer, let us know.
#
Constant Proportions Portfolio Insurance (CPPI)
CPPI seeks to guarantee investors that their assets won't fall below a minimum value. Say 75% of initial assets. The idea is to keep 75% of the assets invested in a safe asset, but leverage (say twice) the remaining 25% -- the buffer -- and invest it in the risky asset. Over time the size of the buffer (i.e. the value of your portfolio above 75% of your initial assets) will change. If you make money the buffer will grow, letting you take on more risk, and if you lose money, the buffer will shrink, forcing you to take less risk. Provided that daily market moves are small, this strategy guarantees that you wont fall much below 75% of your initial asset value.
This simple version of CPPI became is no longer used. Partly because it is associated (for good and bad reasons) with the infamous Black Monday. But also because this simple version has some fundamental issues: after large gains, it will also tolerate large losses before really reducing risk; after large losses, it will not reenter markets again. These issues can addressed by using a rolling family of CPPI strategies, each with a different start date, and with a fixed term.
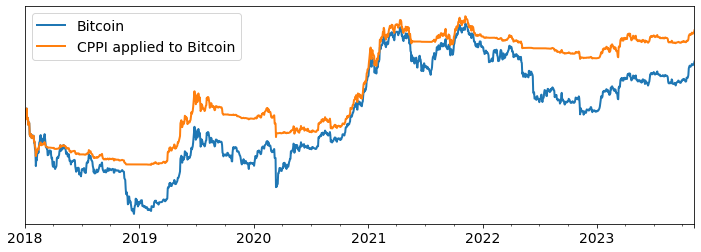
The figure below illustrates the application of a rolling CPPI strategy to Bitcoin from 2018 to 2023. Applying CPPI to Bitcoin generates a performance similar to that of volatility control over the same period: 29% annual returns, for a Sharpe of .62, and a worst case drawdown against the safe asset of 59%.
Over the same period Bitcoin offers an annual return of 18%, a Sharpe of .26, and a maximum drawdown of 82%.
#
Time-series Momentum (TSM)
Time-series Momentum is the simplest trend detection strategy and exploits the fact that asset prices tend to trend more than economic theory anticipates. Concretely, it invests in an asset if the asset has been going up over the last 12, 9, or 7 months, and exits otherwise. Often, it is useful to diversify over a family of TSM strategies with different time spans.
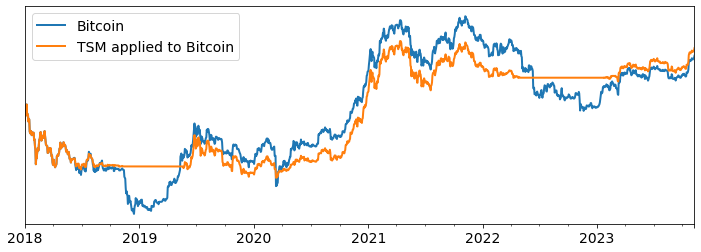
The figure below illustrates the application of a family of TSM strategies to Bitcoin from 2018 to 2023. It does not increase returns -- the strategy generates an average return of 20% -- but limits worst case drawdowns to 53%.
#
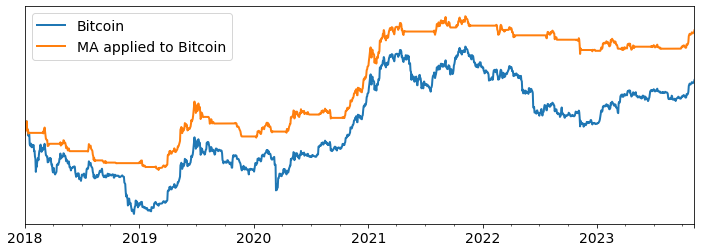
Moving Averages (MA)
We like moving averages, they are simple and they work pretty well. Concretely, they are a variant of time series momentum that seek to detect trends in prices. They do so by comparing the mean price over a recent window (for crypto, we would use the last 5 to 10 days) and a longer window (for crypto we would use the last 30 to 60 days).
If prices are trending up, the recent mean price will be greater than the longer mean price, sending a BUY signal. If prices are trending down, the recent mean price will be less than the longer mean price, sending a SELL signal.
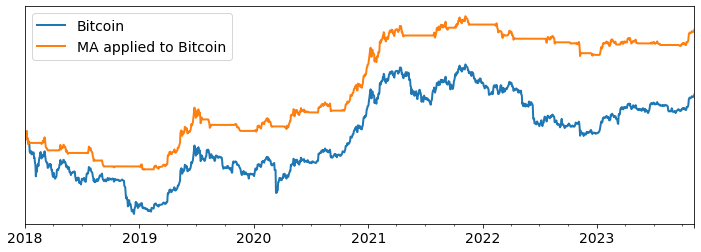
The only difficulty with MAs is that there performance is a little sensitive to the choice of the averaging windows, but other than that, we think they are very useful. The figure below illustrates the performance of moving average strategies with 5 and 10 day short windows, and a 30 day long window. MA with a 5 days short window performs very well. It generates 48% annual returns, with a Sharpe of 1.04 and a maximum drawdown of 55%. MA with a 10 days short window performs slightly less well: it generates a return of 38%, with a Sharpe of .82 and a maximum drawdown of 59%.
#
Bag of Strategies (BoS)
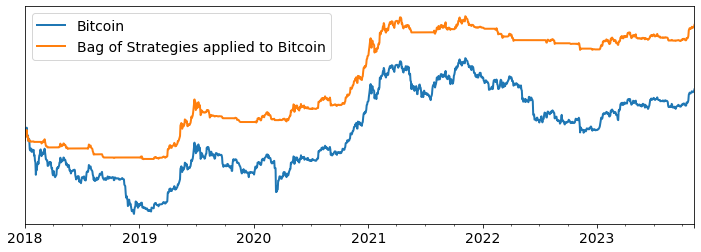
If diversification is the only free lunch, why not apply it to risk-management strategies? This is what we call the bag of strategies approach, and we also quite like it. Simply allocate part of your portfolio to be manage by one of many risk-management strategies, and rebalance regularly.
The question is what to include? Well, provided you include diverse strategies with similar performance, more strategies can only help.
The figure below illustrates the application of a BoS approach to Bitcoin using our preferred version of Drawdown Control, the 5 Days Short Window Moving Average strategy. As anticipated applying BoS to well performing strategies ends up improving their performance further. BoS applied to Bitcoin yields an annual return of 46% for a Sharpe of 1.11 and a maximum drawdown against the safe asset of 48%.