
#
#
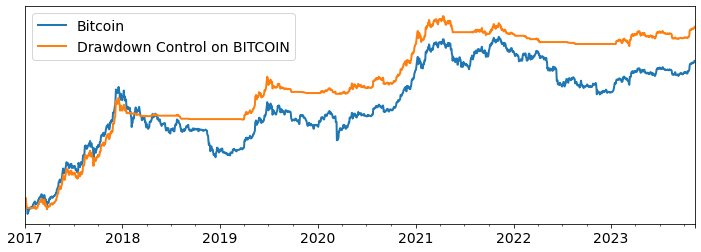
Risk-Managed Bitcoin
Our Risk-Managed Bitcoin Index uses Balanced Drawdown Control to allocate between Bitcoin and USD.
graph LR
    A(Bitcoin) --> B(Drawdown Control)
#
Backtested Returns
In backtests over 2018-2023 the strategy generates annual returns of 44%, with a maximum Drawdown of 53%, and a Sharpe Ratio of 1.
Monthly Returns 2018-2023
| month | Jan | Feb | Mar | Apr | May | Jun | Jul | Aug | Sep | Oct | Nov | Dec | Year |
|---|---|---|---|---|---|---|---|---|---|---|---|---|---|
| year | |||||||||||||
| 2018 | -0.07 | -0.02 | -0.04 | 0.03 | -0.02 | 0.00 | -0.01 | -0.07 | -0.01 | 0.00 | 0.00 | 0.00 | -0.19 |
| 2019 | 0.00 | -0.00 | -0.01 | 0.21 | 0.60 | 0.44 | -0.19 | -0.05 | -0.07 | -0.01 | -0.02 | 0.00 | 0.93 |
| 2020 | 0.06 | -0.04 | -0.03 | 0.13 | 0.07 | -0.05 | 0.23 | 0.03 | -0.11 | 0.23 | 0.45 | 0.48 | 2.40 |
| 2021 | 0.14 | 0.35 | 0.23 | -0.05 | -0.24 | 0.00 | 0.01 | 0.01 | -0.06 | 0.21 | -0.09 | -0.10 | 0.30 |
| 2022 | -0.04 | -0.06 | -0.04 | -0.06 | 0.00 | 0.00 | -0.02 | -0.03 | 0.00 | 0.00 | 0.00 | 0.00 | -0.22 |
| 2023 | 0.09 | -0.02 | 0.20 | 0.02 | -0.07 | 0.10 | -0.04 | -0.11 | 0.01 | 0.25 | 0.03 | NA | 0.49 |