
#
#
Risk-Managed TOP2
Our Risk-Managed TOP2 Index applies Balanced Drawdown Control to each of the TOP2 cryptocurrencies by market cap, and aggregates individual asset allocations using regular rebalancing.
Current underlying risky assets are Bitcoin and Ethereum. The safe asset is USD.
graph LR
    A(Bitcoin) --> B(Drawdown Control)
    C(Ethereum) --> D(Drawdown Control)
    B --> E(Regular Rebalancing)
    D --> E(Regular Rebalancing)
#
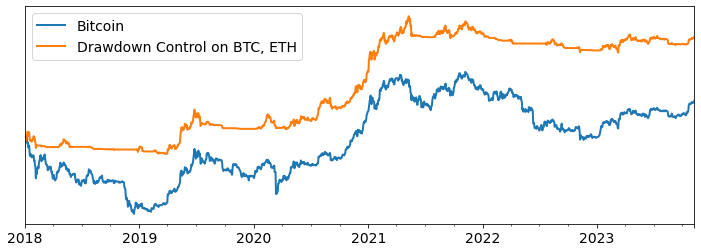
Backtested Returns
Over 2018-2023, the strategy generates a 49.5% returns, with a 54% maximum drawdown, and a Sharpe Ratio of 1.0.
Monthly Returns 2018-2023
| month | Jan | Feb | Mar | Apr | May | Jun | Jul | Aug | Sep | Oct | Nov | Dec | Year |
|---|---|---|---|---|---|---|---|---|---|---|---|---|---|
| year | |||||||||||||
| 2018 | 0.20 | -0.16 | -0.02 | 0.08 | -0.07 | 0.00 | -0.01 | -0.03 | -0.01 | -0.00 | 0.00 | 0.00 | -0.06 |
| 2019 | -0.04 | -0.02 | -0.02 | 0.14 | 0.62 | 0.30 | -0.21 | -0.03 | -0.06 | -0.00 | -0.01 | 0.00 | 0.55 |
| 2020 | 0.06 | 0.08 | -0.11 | 0.11 | 0.07 | -0.01 | 0.38 | 0.13 | -0.14 | 0.11 | 0.45 | 0.33 | 2.40 |
| 2021 | 0.51 | 0.20 | 0.20 | 0.20 | -0.17 | -0.03 | 0.01 | 0.13 | -0.11 | 0.26 | -0.03 | -0.14 | 1.26 |
| 2022 | -0.09 | -0.05 | -0.02 | -0.05 | 0.00 | 0.00 | 0.03 | -0.06 | -0.06 | 0.01 | -0.05 | -0.01 | -0.30 |
| 2023 | 0.09 | -0.02 | 0.17 | 0.03 | -0.04 | 0.06 | -0.04 | -0.10 | -0.00 | 0.12 | 0.03 | NA | 0.32 |