#
#
Regularly Rebalanced TOP2
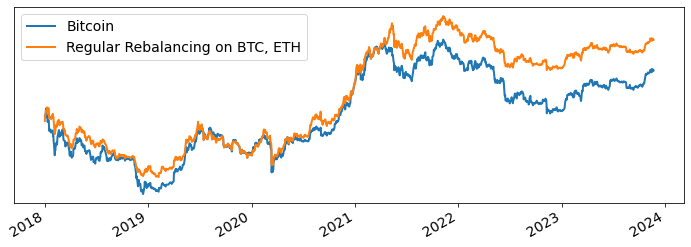
Our Regularly Rebalanced TOP2 Index resets allocation weights to 80% Bitcoin & Ethereum and 20% USDC at a yearly level.
graph LR
    A(Bitcoin) --> E(TOP 2)
    C(Ethereum) --> E(TOP 2)
    E(TOP2)--> B(80/20 Regular Rebalancing)
    D(USDC) --> B(80/20 Regular Rebalancing)
#
Backtested Returns
Over 2018-2023, the strategy generates an annual return of 31%, a 75% maximum drawdown, and a Sharpe Ratio of .5.

| month | Jan | Feb | Mar | Apr | May | Jun | Jul | Aug | Sep | Oct | Nov | Dec | Year |
|---|---|---|---|---|---|---|---|---|---|---|---|---|---|
| year | |||||||||||||
| 2018 | 0.09 | -0.12 | -0.36 | 0.35 | -0.12 | -0.15 | 0.07 | -0.16 | -0.08 | -0.04 | -0.23 | 0.01 | -0.62 |
| 2019 | -0.11 | 0.15 | 0.04 | 0.18 | 0.53 | 0.28 | -0.21 | -0.10 | -0.06 | 0.07 | -0.14 | -0.09 | 0.36 |
| 2020 | 0.28 | 0.08 | -0.30 | 0.36 | 0.06 | 0.00 | 0.35 | 0.16 | -0.13 | 0.12 | 0.49 | 0.28 | 3.09 |
| 2021 | 0.42 | 0.14 | 0.26 | 0.22 | -0.13 | -0.12 | 0.11 | 0.28 | -0.10 | 0.42 | 0.01 | -0.19 | 1.83 |
| 2022 | -0.18 | 0.08 | 0.07 | -0.12 | -0.18 | -0.29 | 0.22 | -0.09 | -0.06 | 0.07 | -0.11 | -0.03 | -0.53 |
| 2023 | 0.29 | 0.01 | 0.16 | 0.03 | -0.04 | 0.07 | -0.04 | -0.10 | 0.02 | 0.17 | 0.08 | nan | 0.78 |